

The largest online marketplaces, ranked by how they win traffic
We compare 100 marketplace domains from 42 countries across eight acquisition channels, measured with Semrush.Trends. Not revenue rankings: the mechanics a seller can act on.
The Marketplace Traffic Index compares how the largest online marketplaces win their traffic. Measured across 100 domains from 42 countries with Semrush.Trends, not guessed. This page reads the numbers the way a seller should read them: as a map of where marketplace demand actually comes from, and what that costs.
01Why rank marketplaces by traffic?
Ranking marketplaces by traffic and its sources tells you how they got big, which is the part a seller can act on. Ranking them by revenue only tells you who is biggest. Revenue is the outcome. Traffic sources are the mechanics.
The index behind this page covers 100 marketplace domains from 42 countries, measured with Semrush.Trends across every major acquisition channel. The ranking shows the top 20 per channel. The measurement window is a fixed baseline, November 2022 to January 2024, and that is deliberate: the point is not this month’s news, it is the structural pattern, and the structural pattern is stable.
02What are the largest online marketplaces by traffic?
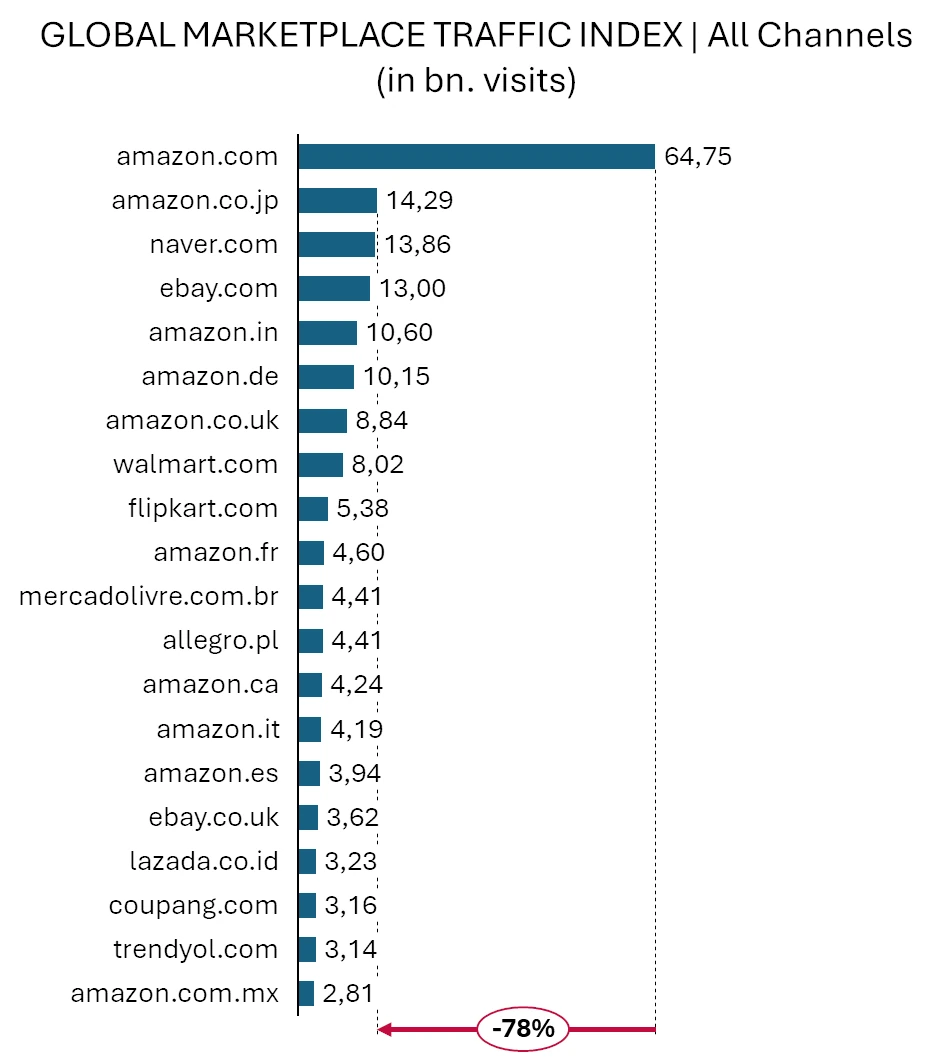
The largest online marketplaces by traffic are led by Amazon.com with 64.75 billion visits, and the gap to second place is 78 percent. Behind it, the top of the table mixes Amazon’s own country domains (amazon.co.jp at 14.29 billion, amazon.in, amazon.de) with three different kinds of competitor: the global horizontal eBay at 13.0 billion, and regional champions like naver.com in Korea at 13.86 billion, MercadoLivre in Brazil and Lazada across Southeast Asia. The ranking is global, but the lesson is not that one playbook wins. Amazon’s dominance and the regional champions’ rise come from opposite motions, and the channel data shows exactly how.
03Where does marketplace traffic come from?
Marketplace traffic comes from eight acquisition channels the index measures: direct, organic search, organic social, paid search, paid social, referral, display, and email. Per channel, one leader, one real number.
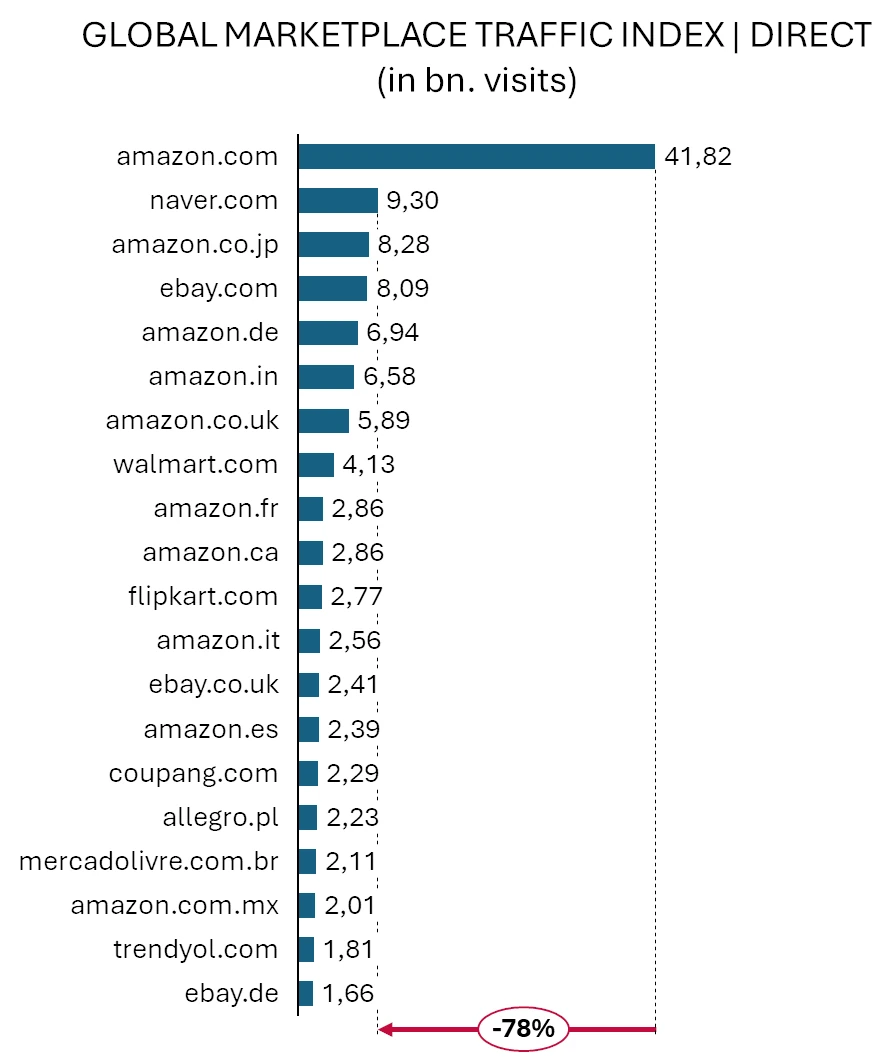
- 01Direct: Amazon, 41.8 billion visits. Gap to second place: 78 percent.
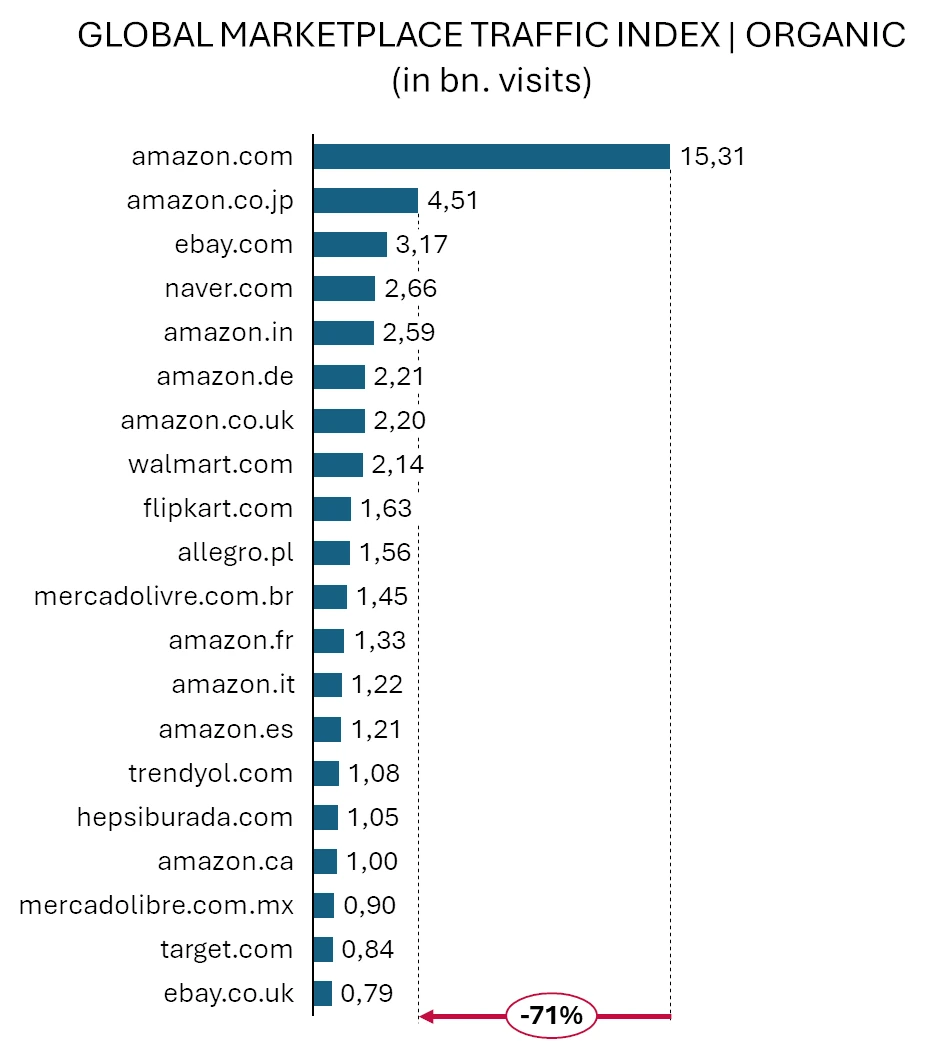
- 02Organic search: Amazon, 15.3 billion visits. Gap: 71 percent.
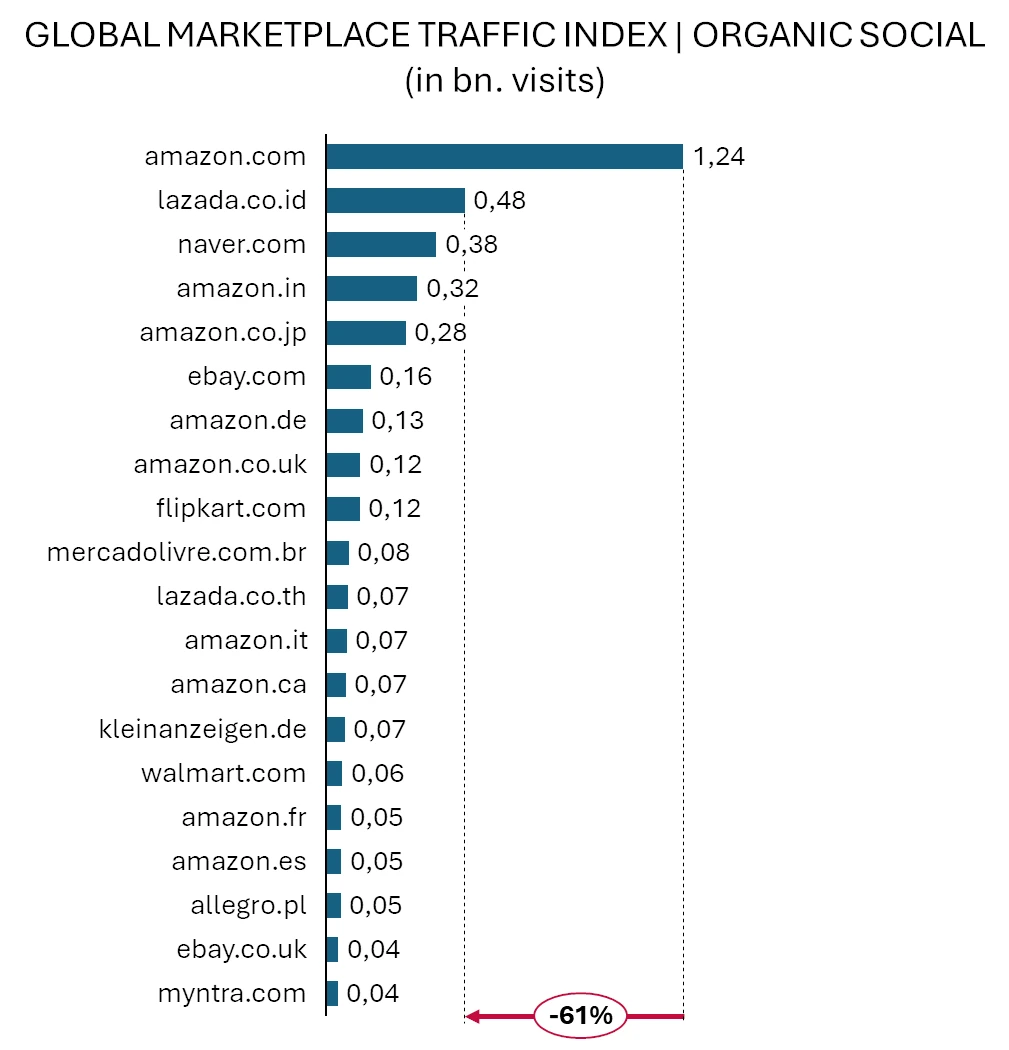
- 03Organic social: Amazon, 1.2 billion engagements. Gap: 61 percent.
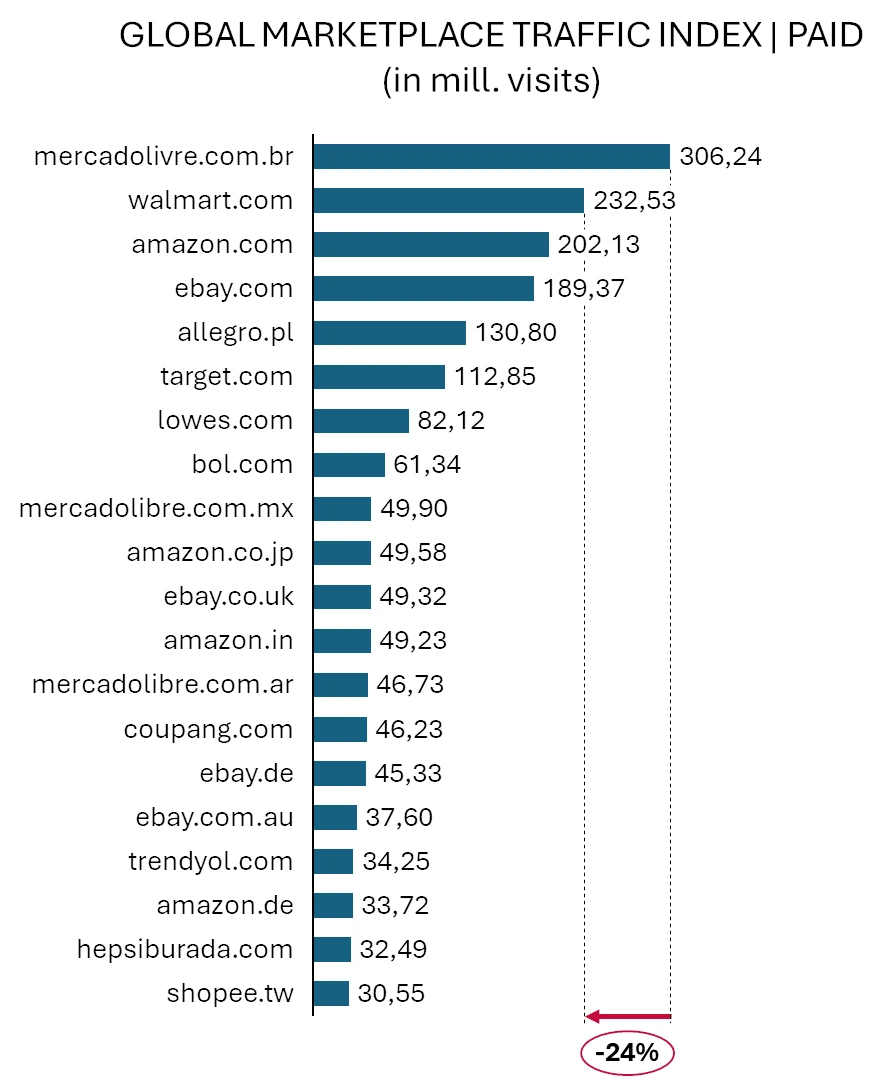
- 04Paid search: MercadoLivre.com.br, 306 million visits. Gap: 24 percent.
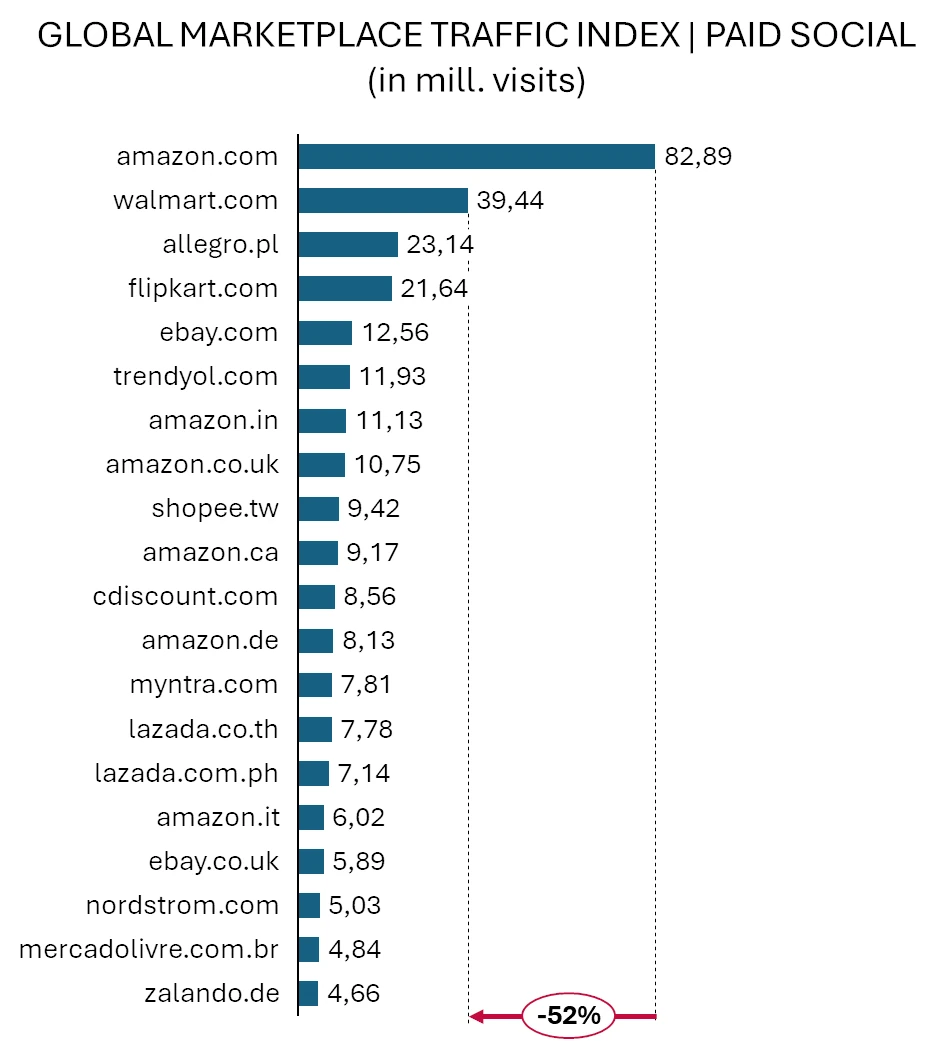
- 05Paid social: Amazon, 82.9 million engagements. Gap: 52 percent.
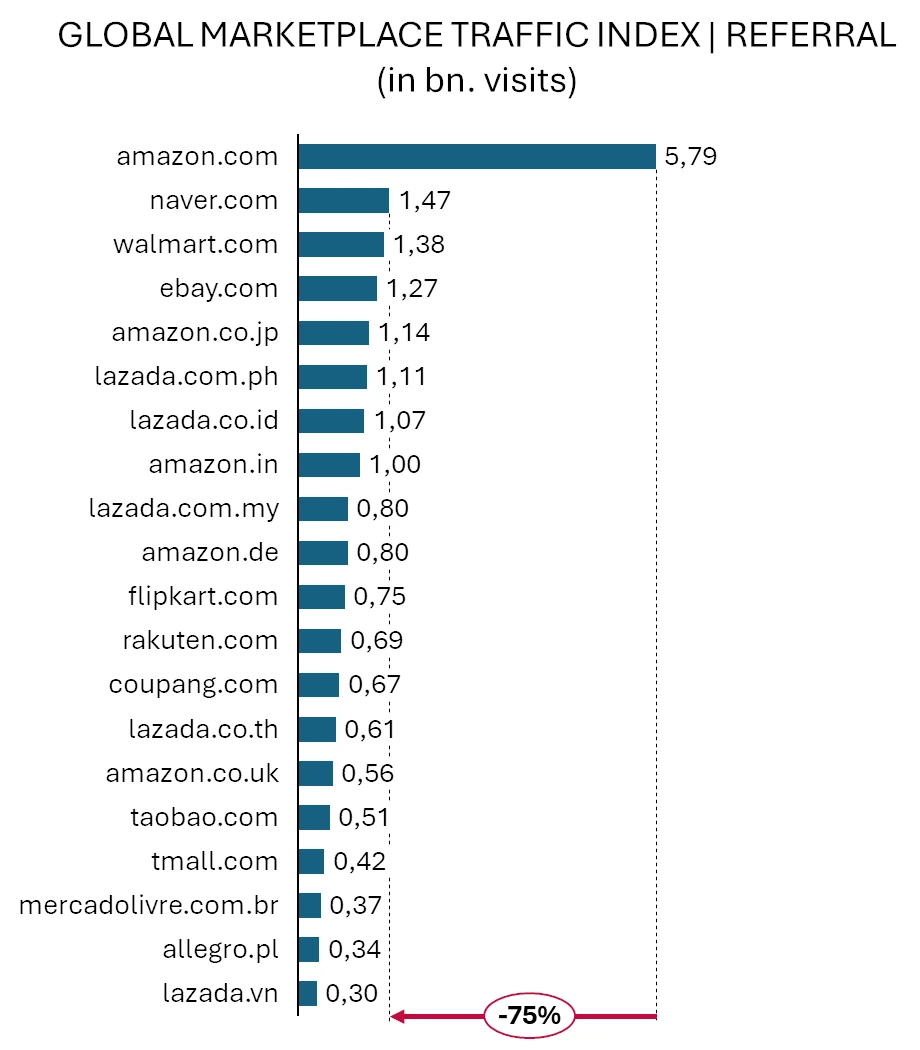
- 06Referral: Amazon, 5.8 billion visits. Gap: 75 percent.
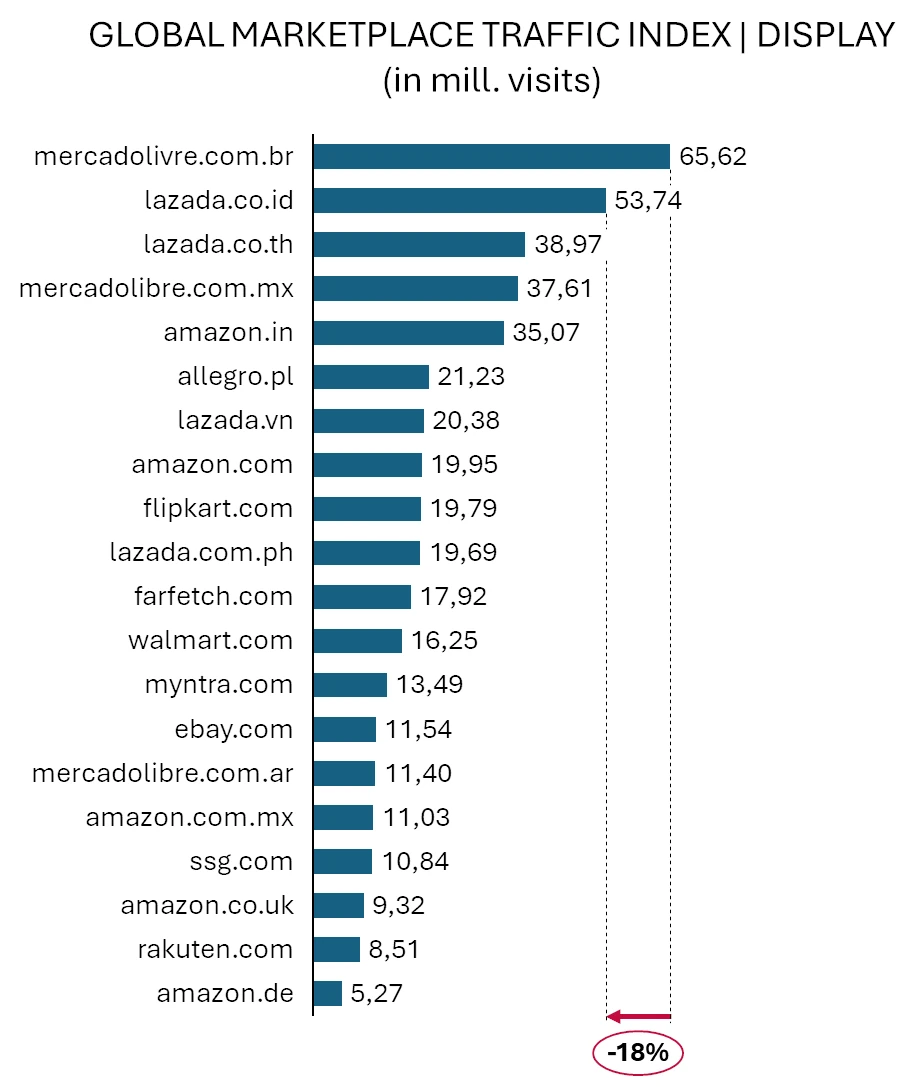
- 07Display: MercadoLivre.com.br, 65.6 million impressions. Gap: 18 percent.
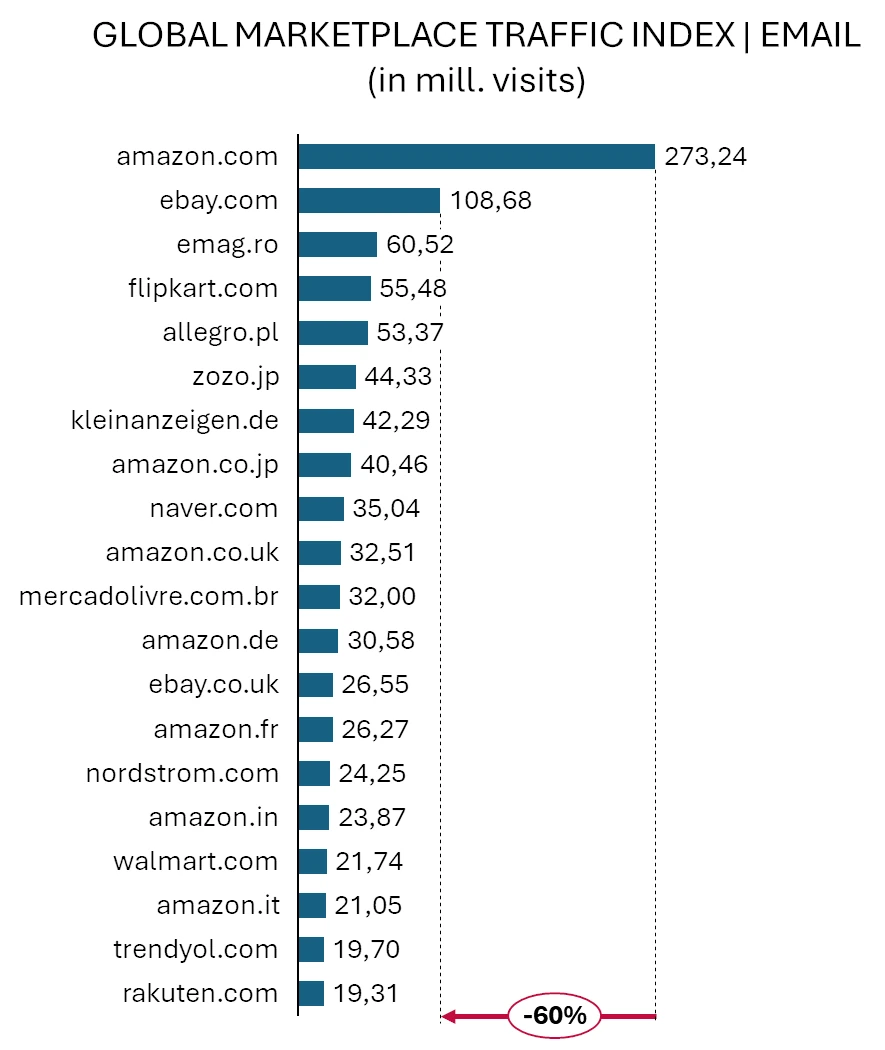
- 08Email: Amazon, 273 million visits. Gap: 60 percent.
Amazon leads six of the eight channels in the index. MercadoLivre takes the two it pays for. The full per-channel rankings:
04What do the channel patterns mean?
The channel patterns carry two readings, and the gap numbers prove both.
First, Amazon’s mix is brand pull. Direct traffic dwarfs every other number in the dataset, organic search compounds it, and email keeps the loop closed. In exactly those channels the gap to second place is largest: 78 percent in direct, 75 percent in referral, 71 percent in organic search. Those are moats. A mature demand engine looks like this: the customer does not find Amazon through a channel, the customer starts at Amazon and the channels feed the habit.
Amazon is not found. It is where the search starts.
Second, the paid channels are where the moats end. In display the gap from first to second is only 18 percent, in paid search 24 percent, and the leaders there are not Amazon: MercadoLivre in Brazil tops both, with Walmart, Lazada, Allegro and Flipkart close behind. Bought reach is the one market where challengers compete on even terms, because money buys the same inventory for everyone. That is not a weakness of the challengers, it is a growth footprint: a platform still expanding its habit buys the demand it does not yet own. Reading a marketplace’s channel mix tells you where it is in its own lifecycle, and what kind of partner it will be for a seller.
05What should sellers read from this?
Three consequences follow from the data.
First, a marketplace is a channel of channels. When your product sells there, your effective traffic mix is the platform’s traffic mix, and the same measurement logic applies that we describe for e-commerce KPIs along the effect chain: start at revenue and walk backwards through the platform’s own funnel.
Second, which kind of marketplace you sell on shapes everything. A global horizontal delivers reach and takes findability; a specialist delivers intent and takes volume. The distinction has its own page: horizontal vs. vertical marketplaces.
Third, the traffic a marketplace buys, it re-sells. The paid channels in this index are the supply side of retail media: the platform acquires demand and prices access to it back to brands, placement by placement. Whoever negotiates those placements without a picture of where the platform’s demand comes from negotiates blind.
06The next step
If you sell through marketplaces and decide budgets there without a channel-level picture of the platforms you depend on, let us talk for 30 minutes. We show you how to read a marketplace’s traffic mix and what it means for your placement and pricing decisions.